Waterfall Chart
A Waterfall Chart is undoubtedly one of the most useful tools for Web Performance Optimization.
https://speedvitals.com/report/
A waterfall chart can do the following:
- List the order of each Request on the Web Page
- Display the timings & performance of each resource
- Display the Request & Response Headers
- Help find performance bottlenecks
- Allows an in-depth visualization of the website's resources
and a lot more!
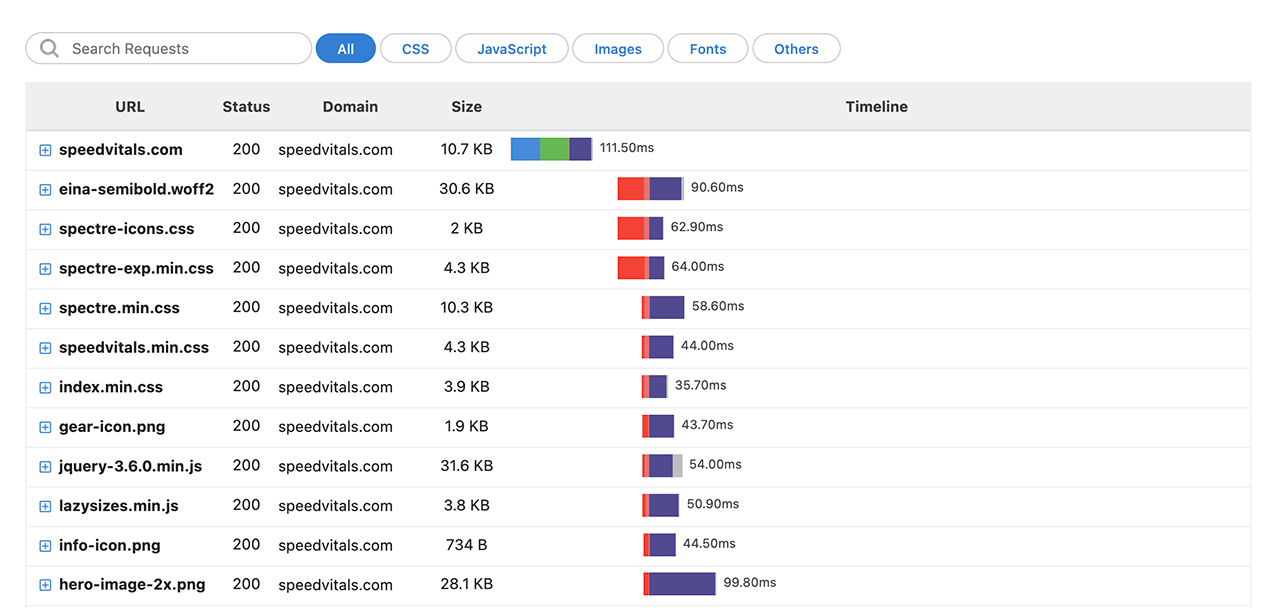
⚡️ SpeedVitals Waterfall Chart has a modern, clean, and minimal design.
The Waterfall Chart also has Search & Sorting features that can help you quickly discover a particular request.
If you have at the bar on timeline, you'll find various important timings such as:
- Blocking Time: Time taken by the request in the browser's queue waiting to be executed
- DNS Lookup: Time taken to resolve the DNS of hostname
- Connecting: Time taken by the TCP Connection between server and browser
- Sending: Time taken by browser to send the request
- Waiting: Time taken by the server to respond to a request (Server Response Time)
- Receiving: Time taken by browser to download the response