Field Data
Alongside the Lab Data obtained using Lighthouse Test, ⚡️ SpeedVitals also displays Field Data which is collected from Chrome User Experience Report.
The Chrome User Experience Report collects the real-world performance data of real users who have opted for usage statistic in Chrome.
Both Google PageSpeed Insights and ⚡️ SpeedVitals displays Field Data but PageSpeed Insights data is limited to last 28 days.
⚡️ SpeedVitals takes it a step further by displaying both last 28 days data as well as last 12 month data.
The field data section can be accessed by Selecting the Field Data Tab on the Performance Report.
SpeedVitals displays the Field Data for both the Tested Web Page as well as the Entire Domain. Both are further divided into Mobile & Desktop Categories. This is the structure of the Field Data setion:
- Current Web Page
- Last 28 Days Data
- Mobile Data
- Desktop Data
- Last 28 Days Data
- Entire Domain
- Last 28 Days Data
- Mobile Data
- Desktop Data
- Last 12 Months Data
- Mobile Data
- Desktop Data
- Last 28 Days Data
Currently, the last 12 Months Data is only available for the Entire Domain and not every Web Page.
Last 28 Days
The last 28-days data is represented in form three seperate bars for each category of performance tier, i.e. good, needs improvement, and poor.
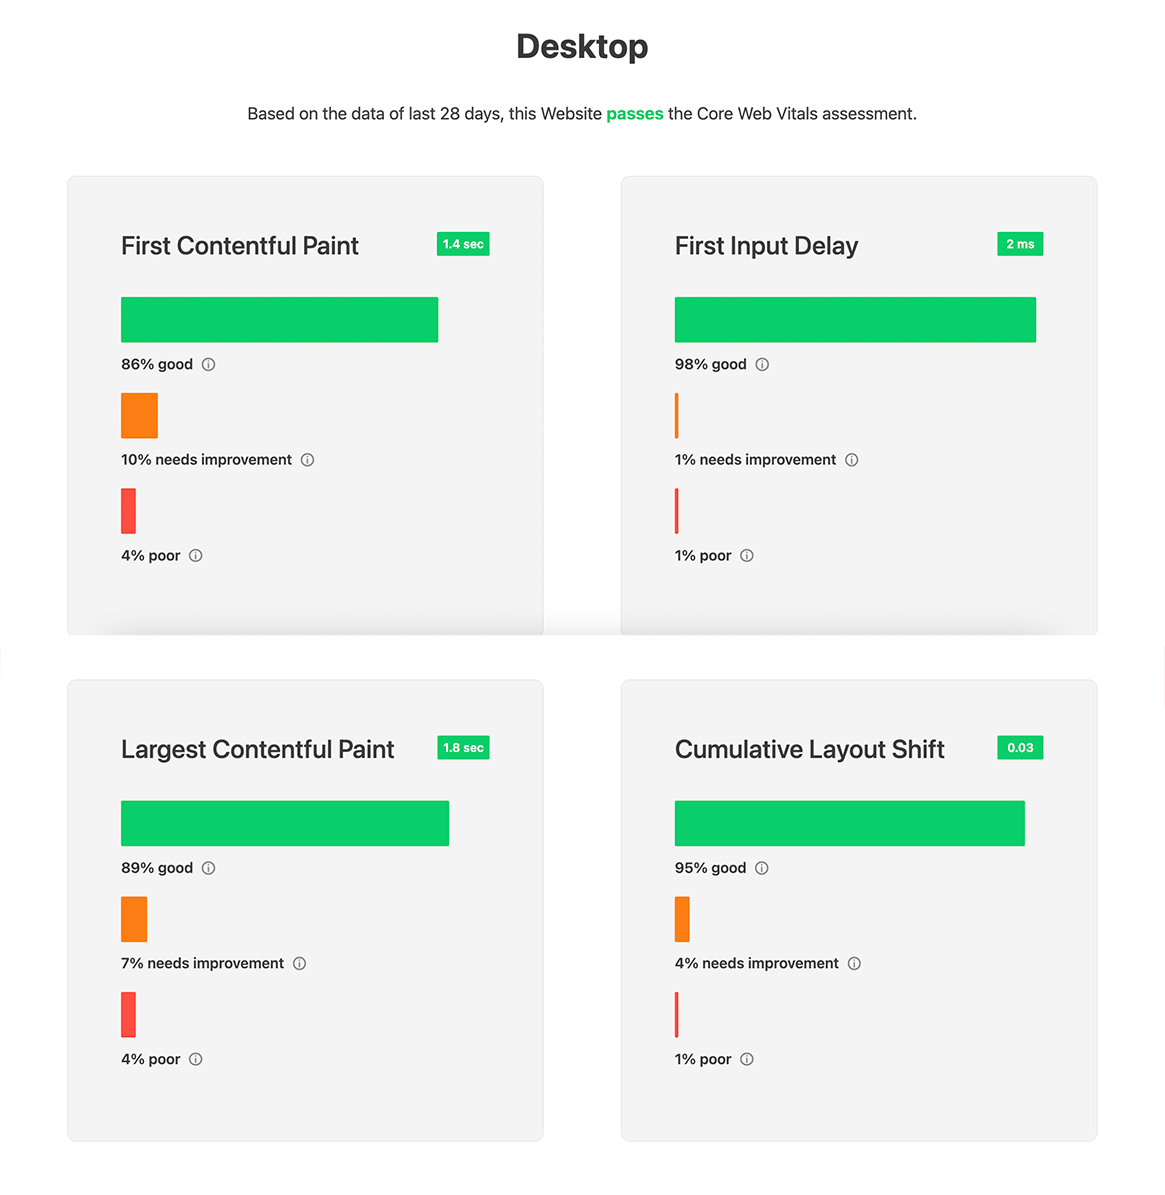
Each performance is present inside the card and the 75th Percentile value is written next to the metric name.
Last 12 Months
The last 12-months data is represented in the form of 12 bars, each representing a month.
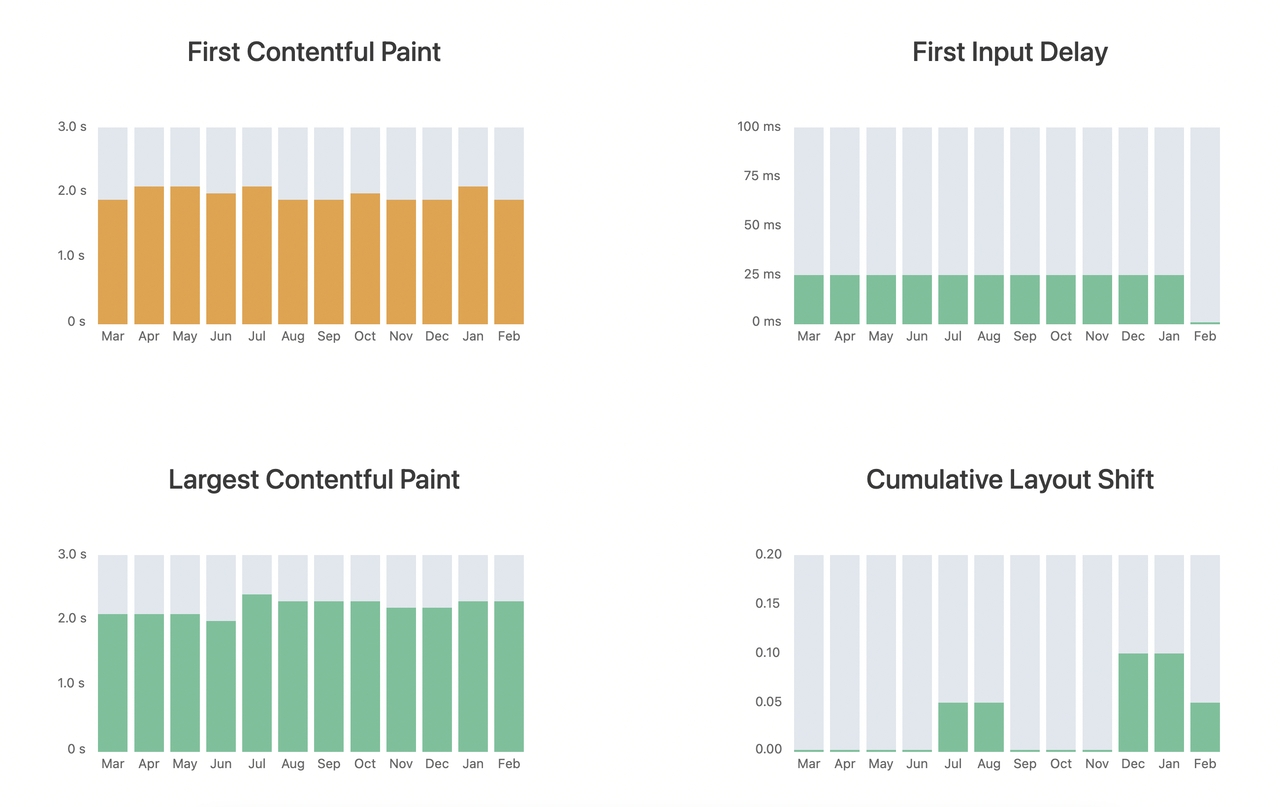
Hovering on a bar will display the detailed performance numbers of the selected month. The smaller each bar is, the better is the performance.
The last 12-months data can help you visualize the performance trend over the course of an year.