Web Vitals
Web Vitals is a collection of Web Performance metrics by Google that emphasize on real-world User Experience.
Google announced Web Vitals in May 2020, and as of right now, they are a Search Engine Ranking Factor post the Google Page Experience Update.
Google measures these signals using the real-world data from Google Chrome users that have Usage Statistics enabled. This is also known as Field Data and it is obtained from the Chrome User Experience Report (CruX Report).
Overview
Web Vitals are next-generation metrics for Web Performance Evaluation that mainly focuses on User Experience and not just raw numbers.
Google is continuously evolving Web Vitals by introducing changes as well proposing new metrics such as Animation Smoothness and Page Responsiveness Time that we might see in the near future.
In the past, Web Performance was mainly analyzed using raw performance metrics such as Total Page Load Time. However, a metric such as Total Page Load Time will not always be a reliable indicator for this purpose.
For example, Let's say Web Page 'A' takes 10 seconds to load but its viewport contents load within 1 second. While Web Page 'B' takes 5 seconds to load but the viewport contents take 4 seconds to load. Technically, Web Page 'B' has a lower total page load time but that doesn't translate to a good User Experience.
As most of you might have already guessed, the name of ⚡️ SpeedVitals is also inspired by Web Vitals.
What are Core Web Vitals
Core Web Vitals are a subset of Web Vitals. These are the most important Web Vitals as they tackle three major aspects of User Experience:
- Loading
- Layout Stability
- Interactivity
Each of the above User Experience metrics is represented using the following Web Vitals:
- Largest Contentful Paint (LCP)
- Cumulative Layout Shift (CLS)
- First Input Delay (FID)
These are just the current aspects of User Experience, and they will continue to evolve. We can expect Google to announce new Core Web Vitals in the near future.
| Metric | Core Web Vital |
|---|---|
| Loading | Largest Contentful Paint |
| Layout Stability | Cumulative Layout Shift |
| Interactivity | First Input Delay |
For a Web Page to pass in a particular Core Web Vitals metric, its 75th Percentile of Page Loads should have a good score. If it passes all three Core Web Vitals (LCP, CLS, FID), it is considered to Pass the Core Web Vitals as a whole.
In Google Search Console and Page Experience Update, the Core Web Vitals Performance have separate sections for Mobile & Desktop.
Let's take a look at each of the three Core Web Vitals in-depth.
Largest Contentful Paint
The Largest Contentful Paint represents the Loading Performance of a Web Page. It is the time taken to display the largest content in the viewport.
The largest contentful element is a single element and it is usually an image or text segment. LCP is the acronym for Largest Contentful Paint.

To get a Good LCP Score, the LCP Element needs to render within 2.5 seconds. LCP score is considered poor if it is higher than 4.0 seconds.
Vodafone improved its LCP by 31%, resulting in an 8% increase in sales and a 15% increase in their lead to visit rate.
⚡️ SpeedVitals Performance Report marks the LCP Element automatically.
You can find the LCP Element on the Performance section of the report page.
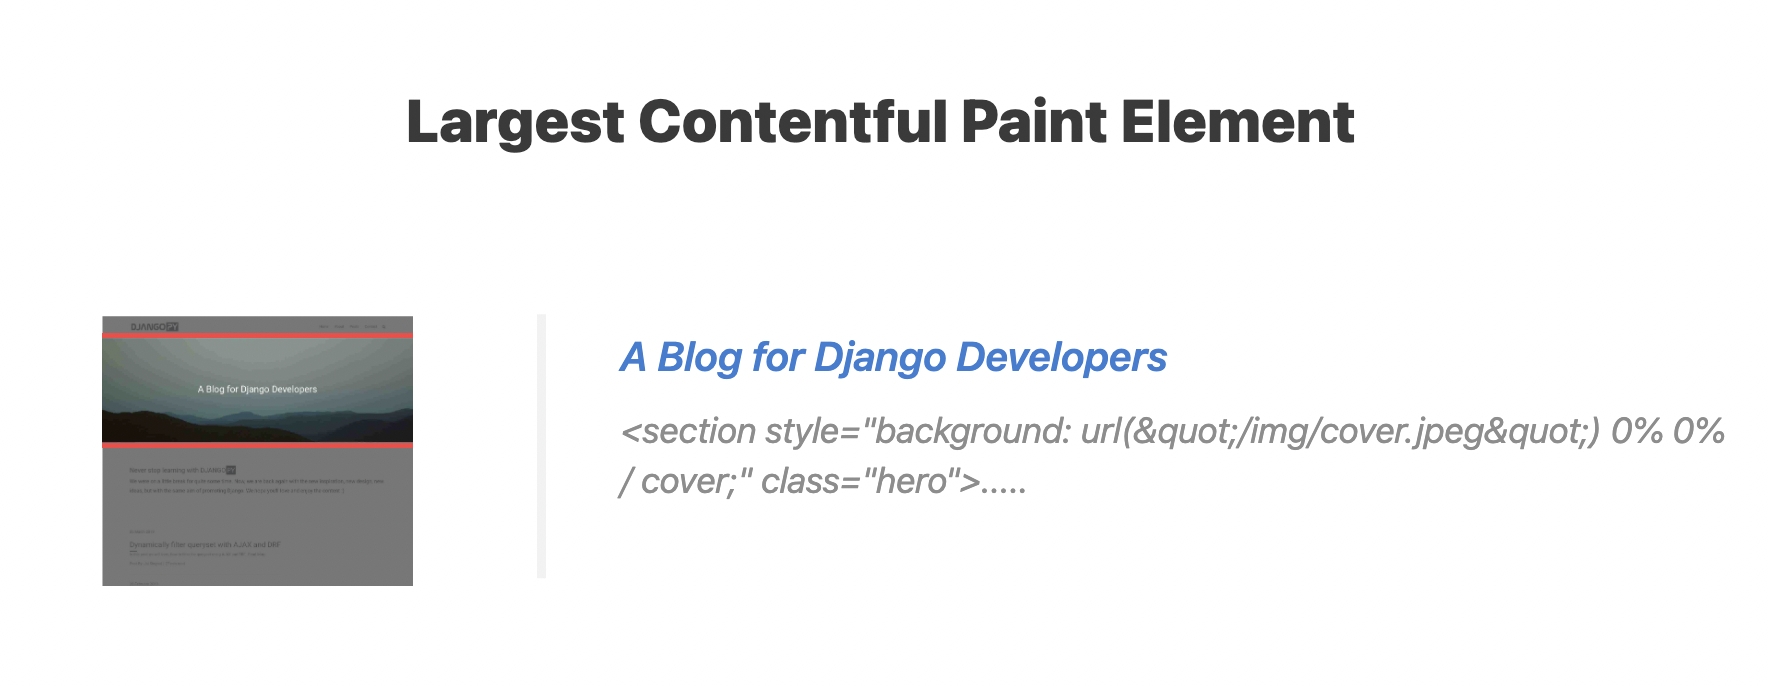
Clicking on the Element Image zooms it in for better visualization.
Tokopedia improved LCP by 55% and saw a 23% increase in average session duration.
Cumulative Layout Shift
Cumulative Layout Shift or CLS is a metric that measures the layout stability of a page.
It measures the unexpected shifts of page content throughout the user session.
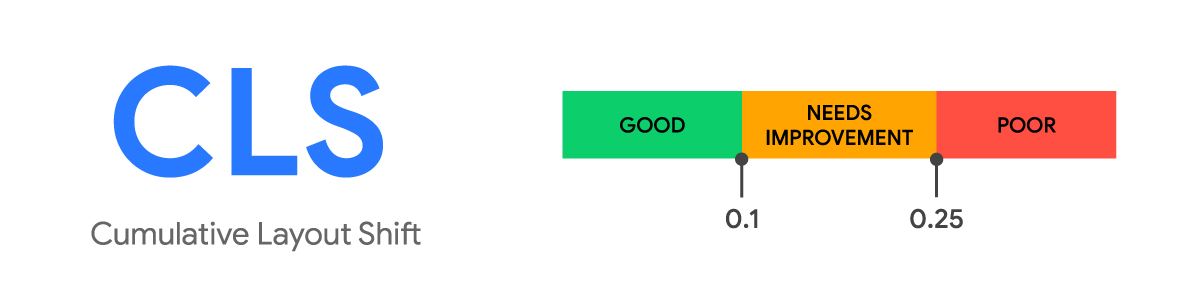
To achieve a Good CLS Score, its value should be less than 0.1.
A Poor CLS Score has a value over 0.25.
The implementation for the calculation of layout shifts is described in the Layout Shift API.
layout shift score = impact fraction * distance fraction
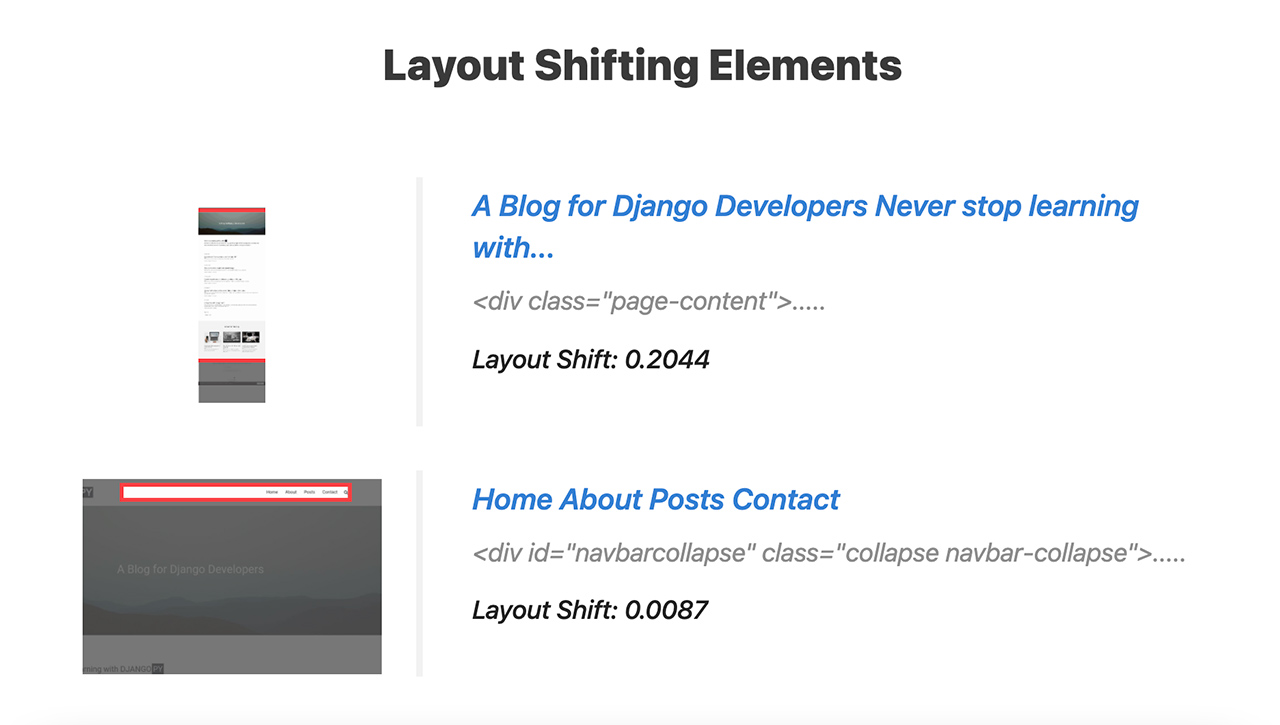
⚡️ SpeedVitals has a Layout Shift Visualization feature that makes a Layout Shift GIF to understand it better.
This feature can be accessed from the Performance Section of the Report Page.

⚡️ SpeedVitals also marks the individual CLS Elements in the Page Screenshot.
You can also view the contribution to CLS by all the elements individually.
Yahoo News Japan reduced CLS by 0.2 and they saw a 15.1% increase in page views per session and 13.3% longer session durations.
Compared to other Web Vitals, Layout Shift is hard to diagnose as Lab Testing Tools are not able to detect layout shifts that happen post the initial load of the page.
However, the Field Data takes into consideration all Layout Shifts during the session.
iCook improved CLS by 15% and as a result, saw a 10% increase in their ad revenue.
First Input Delay
First Input Delay measures Interactivity or Responsiveness on a Web Page. This metric comes into play when a user interacts with the page (such as a button press or link click).
It is the time duration between the first user interaction with the page and the time taken by the browser to respond & start processing the event handlers corresponding to that event.
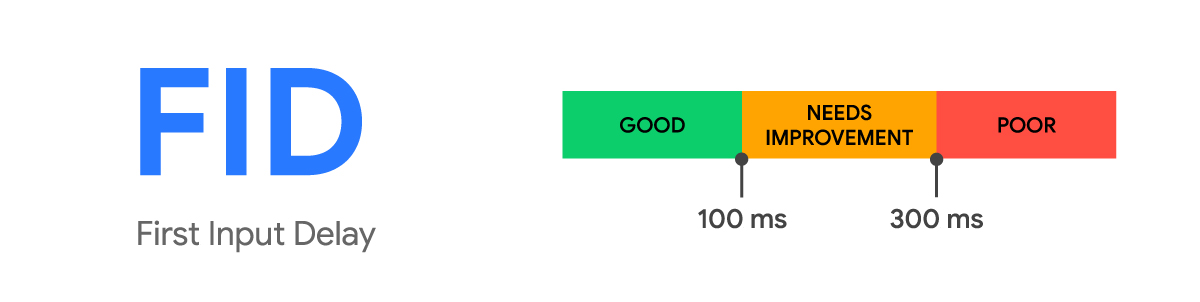
For a good score, the FID value should be less than 100 ms. The score is considered poor if the FID value is higher than 300 ms.
First Input Delay can only be measured by Real-world Field Data Testing Tools and not the Lab Tests.
Web Vitals vs Core Web Vitals
The main difference between the two is that Core Web Vitals are a subset of Web Vitals and these are the ones that are currently used for Search Engine Ranking.
Core Web Vitals are a part of Google's Page Experience Update while the rest of the Web Vitals are not a ranking factor but can help diagnose Web Performance issues.
Here's a list of which Web Vital can be measured using which type of test:
| Web Vitals | Measurement in Lab Test | Measurement in Field Test |
|---|---|---|
| Largest Contentful Paint | ✅ | ✅ |
| Cumulative Layout Shift | ✅ | ✅ |
| First Input Delay | ❌ | ✅ |
| First Contentful Paint | ✅ | ✅ |
| Total Blocking Time | ✅ | ❌ |
| Time to Interactive | ✅ | ❌ |
| Speed Index | ✅ | ✅ |
First Input Delay can only be measured in Real-world tests. For this reason, Core Web Vitals as a whole are only measured using Real-user monitoring.
Google Page Experience Update
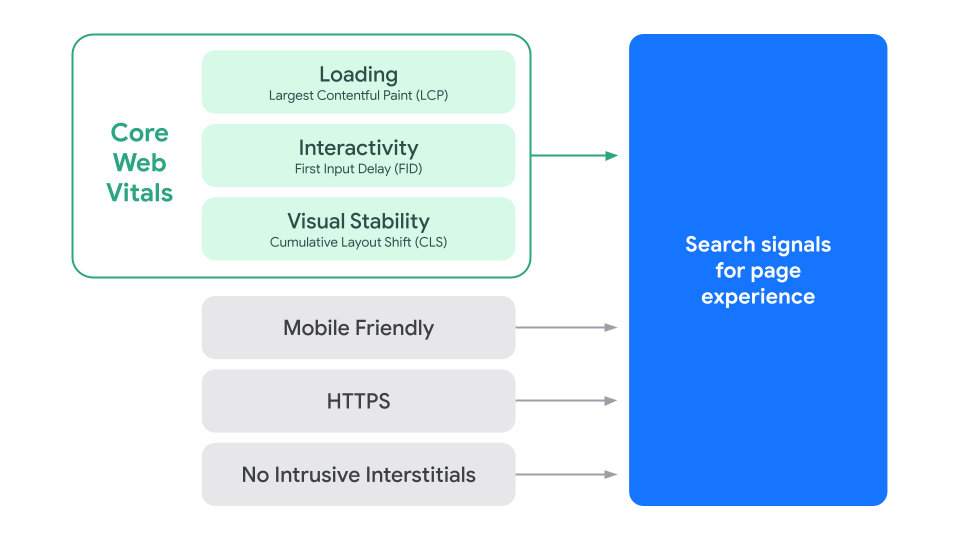
Google's Page Experience Update is a new search ranking algorithm that takes various aspects of User Experience into consideration. These aspects are:
- Loading Speed (Largest Contentful Paint)
- Interactivity (First Input Delay)
- Visual Stability (Cumulative Layout Shift)
- Mobile Friendliness
- HTTPS
- No Intrusive Interstitials
To get rewarded by this algorithm, a website must pass the six factors listed above.
As of now, the Google Page Experience Update is live for both Desktop and Mobile Results.
On Mobile, Google initiated the Page Experience Update in June 2021. While on Desktop, the update was initiated in February 2022.
NDTV, one of India's leading News websites, when improved LCP by 55% and saw a 50% reduction in bounce rate.
Other Web Vitals
Other than the three Core Web Vitals, there are numerous other Web Vitals that serve a different purpose and are useful in diagnosing Website Performance.
While these may not play a direct role in Search Rankings, passing them is a good practice in order to achieve a fast-loading Website and deliver a better user experience.
Let's take a look at each of the other Web Vitals.
First Contentful Paint
First Contentful Paint is the time taken to load the first content on a Web Page. The first content could be any element such as a text or an image.
The difference between FCP & LCP is that LCP measures the time to load the largest content while FCP measures the time to load any first content in the viewport.
A good First Contentful Paint score is below 1.8 seconds. FCP above 3.0 seconds is considered poor.
Total Blocking Time
Total blocking time is used to measure load responsiveness. It is defined as the total time between the First Contentful Paint and Time to Interactive where the main thread was blocked for a long duration which prevented user responsiveness.
Whenever a task takes more than 50 milliseconds, the main thread is considered to be blocked. When the main thread is blocked, the browser cannot interrupt the task.
A TBT score below 200 ms is considered good while a score above 600 ms is considered poor.
Time to Interactive
Time to Interactive is another metric focused on load responsiveness.
Time to Interactive or TTI is defined as the time taken by the Web Page to become fully interactive so that it can reliably respond to user input quickly.
Time to Interactive helps identify those situations where a page looks interactive, but in reality, it isn't.
A TTI score below 3.8 seconds is considered good while a score above 7.3 seconds is considered poor.
Speed Index
The Speed Index metric measures how quickly the content is displayed during the Web Page Load.
Speed Index is a useful metric to understand the perceived loading of a Web Page.
A good Speed Index value is below 3.4 seconds. Speed Index is considered poor if it is above 5.8 seconds.
How to Measure Them
You can check Web Vitals using various different tools. Some tools report Lab Data while others report Field Data. Some tools can report both the Lab and Field Data.
Lab Data vs Field Data
The main difference between Lab & Field Data is that Lab Testing is done in a simulated environment with a predefined configuration. While Field Data is collected from real users who visit that website.
Both Lab & Field Testing is important for analyzing Web Performance.
Lab Tools
SpeedVitals
SpeedVitals is a Lighthouse-powered tool that has extended the Lighthouse even further with exceptional features such as Bulk Testing, Layout Shift Visualizer, Waterfall Chart, Pro Performance Tips, and auto-generation of preload snippets.
SpeedVitals allows Performance Testing from over 15 different locations and devices. We also support Bulk Testing by which you can run a lab test from Multiple-Locations and Multiple-Devices at the same time.
Google PageSpeed Insights
Google PageSpeed Insights is a tool by Google that is also based on Lighthouse. PageSpeed Insights is an excellent free tool for doing Lab Testing and it performs the test on both Mobile & Desktop configurations.
Lighthouse
Lighthouse is an open-source Web Performance Test Tool built by Google. Most of the modern Web Vitals testing tools including SpeedVitals & Google PageSpeed Insights are powered by Lighthouse.
Lighthouse is also integrated with Google Chrome and it can be accessed by opening the Developer Tools and clicking the Lighthouse Tab.
However, we do not recommend Web Performance testing using Lighthouse locally on your system or via Google Chrome as Lighthouse requires performance calibration for every device and without the calibration, the scores can either be too high or too low based on your System's Hardware Capabilities.
Field Tools
SpeedVitals
Just like Lab Testing, SpeedVitals also reports Field Data. The Field Data is collected from Chrome User Experience (CrUX) API which consists of real users that run Google Chrome with User Statistics Enabled. This is the same data source like the Google PageSpeed Insights and Google Search Console.
While Google PageSpeed Insights only reports the Field Data for the last 28-days, SpeedVitals reports Field Data for both the last 28-days as well as the last 12-months.
Google PageSpeed Insights
Google PageSpeed Insights also reports Field Data alongside Lab Data. The source of Field Data is Chrome User Experience (CrUX) API.
Web Vitals JS Library
By installing the Web Vitals JS Library on your Website, you can measure the performance data from all your website visitors. While Google Chrome only collects performance data from users with Usage Statistics enabled, this Library will collect data from all your website visitors leading to more reliable scores.
Web Vitals Chrome Extension
Addy Osmani from Google has developed an excellent Browser Extension that reports live Web Vitals Data as you open a Web Page.
This extension can help diagnose Field Data more effectively.
How to Improve Them
As Web Vitals are an evolving metric and as a Website's Performance would change based on any change in the Code/Content/Server Load, fixing Web Vitals isn't a one-time thing.
Improving Web Vitals requires a proper strategy and a decent knowledge of Web Performance and Testing Tools to identify the issues and implement the best strategies to resolve them.
Here's a three-step flow to ensure that a Website remains fast:
- Measure Website Performance using Lab Testing Tools and Identify issues
- Resolve the Issues and get a Good Performance Score
- Monitor Web Performance regularly in both Lab & Field Tools to ensure new changes aren't causing a regression
After making improvements to LCP & CLS, Agrofy saw a 76% reduction in their abandonment rate and a significant boost in engagement.
Let's take a deeper look at how you can improve Web Vitals:
The first step is to identify whether the Server-Side Performance is the biggest bottleneck or the Client-side or both are equally responsible. An easy way to identify is by looking at the Server Response Time (TTFB). A higher TTFB can indicate poor server-side performance.
If Server-Side Performance is the bottleneck, consider improving the back-end Code, implementing memory caching, and improving database performance. Investing in a Hosting Service with better Hardware resources can give a big boost to Server-side performance.
But nothing compares to a Static Site hosted globally using a service such as Cloudflare Pages or Netlify. Most modern websites can be fully or partially converted to static and that can make the site lightning fast. We have a guide on the same.
If Client-Side Performance is the bottleneck, follow the recommendation from the Web Performance Testing to get higher scores. In addition to Lighthouse recommendations, SpeedVitals also reports custom-curated Performance recommendations that are easy to implement and they can give a major performance boost.
Frequently Asked Questions
Here are some very common questions that are asked in regards to Web Vitals.
Q. How much do they affect ranking?
According to Google's John Mueller, Core Web Vitals is more than just a tie-breaker. However, the website's content quality, authoritativeness, trustworthiness, and relevance to the Search Query will remain a bigger factor.
But Core Web Vitals & other Page Experience Signals are easier to improve and they can be quantified than the rest and they should be given a priority.
Moreover, Core Web Vitals not just improve the search rankings but also improve the UX which results in better engagement, more conversions, and a reduction in bounce rates.
Q. What is the most important Core Web Vital?
While each Core Web Vital is important for a good user experience, the LCP is undoubtedly the most important factor as it measures the loading behavior and is the first one to come into play during the user session.
Q. Does Core Web Vitals affect SEO?
Yes, Core Web Vitals affect SEO as they are a part of Google Page Experience Update alongside other Page Experience Signals such as HTTPS, Mobile Friendliness, and No Intrusive Interstitials.
Q. When is Core Web Vitals update?
Core Web Vitals is already live for both Mobile and Desktop Search Results. For Mobile, the rollout began in June 2021 and for Desktop, the rollout began in February 2022.
Q. Why did Google go with Core Web Vitals rather than load time?
Load Time doesn't necessarily represent a good User Experience while Core Web Vitals use a combination of various UX Signals such as Loading, Layout Stability, and Responsiveness to help measure the User Experience.
Q. Why my Field Data is different than Lab Data?
Field Data is measured from real users that visit a website while Lab Data is measured in a simulated environment with preconfigured settings. An average website visitor could have better/worse device and internet connectivity than the Lab Test Settings.
Some Web Vitals such as Cumulative Layout Shift are measured during the entire session duration during a real-visit. However, Lab Testing Tools only measure them during the page load resulting in a different score.
Q. Why is my Lighthouse score different from PageSpeed Insights?
Running Lighthouse locally will give different scores on different systems due to the different hardware capabilities of each device. The score in PageSpeed Insights is performed on a system where performance calibration is done by introducing performance throttling.
Each system requires calibration in order to report scores similar to PageSpeed Insights. SpeedVitals devices are already calibrated on a similar level as Google PageSpeed Insights.
Q. Does Google use field data or lab data?
Google uses Field Data for its Page Experience Search Algorithm. However, Lab Data is equally important to diagnose and fix performance issues.
Q. What is the difference between PageSpeed Insights and Lighthouse?
Lighthouse is an open-source Performance testing tool built by Google. While PageSpeed Insights is a Website Testing Platform that uses Lighthouse to analyze Web Pages.