Resource Graphs
The resource graphs section contains two donut charts for:
- Total Size of Each Resource Type
- Count of Each Resource Type
https://speedvitals.com/report/
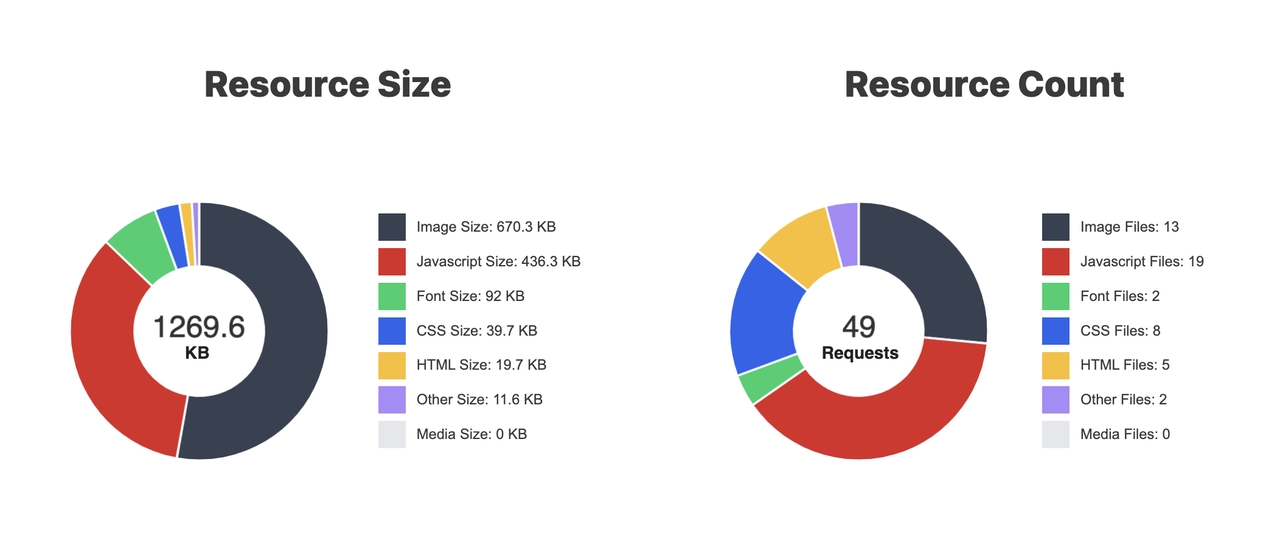
The chart makes it extremely easy to visualize the resource distribution on a website and can be an indicator for the resources that require minification and compression.
In most cases, the resources occupying the most size can be one of the potential performance bottlenecks, but it isn't true for every web page.
Inside the Donut Chart, you'll also find the total resource count as well the total size of the Web Page.